Call-to-Demo Ratio: How to Calculate It and What’s Good

Your call-to-demo ratio is the share of calls that end with a completed product demo. Divide completed demos by the calls in one clearly defined group, such as discovery calls, over a set period. A healthy number depends on which call and which demo you count. For discovery calls in mid-market B2B SaaS, published benchmarks cluster between roughly 23% and 45%. For cold dials, the figure is a low single digit. Most of the confusion is about definitions, not performance.
I’ve watched teams argue over this metric in pipeline reviews. One rep says 40%, another says 12%, and both are right because they are counting different things. This guide gives you one definition, one formula and a set of benchmarks you can compare against honestly.
TL;DR
- Call-to-demo ratio = completed demos divided by calls in one defined group (cold, warm or discovery), times 100.
- Never blend call types. Cold dials, warm calls and discovery calls each get their own ratio.
- Realistic benchmarks: about 23% median for discovery to demo, 35-45% called healthy for mid-market, and 2-3% for cold calls to meetings.
- A ratio above 50% usually means weak qualification, not great selling. Check demo-to-opportunity before you celebrate.
- Track show rate, demo completion and demo-to-close alongside it, or the number misleads you.
Table of Contents
- What call-to-demo ratio actually measures
- How to calculate it, step by step
- What is a good call-to-demo ratio in US B2B SaaS?
- Why the ratio varies so much between teams
- How to raise the ratio without hurting demo quality
- Track it next to the numbers that follow it
- See your own ratio without the spreadsheet
- FAQ
- Sources
What call-to-demo ratio actually measures
The metric answers one question: of the conversations we had, how many moved to a product demonstration? That sounds simple, but “demo conversion rate” is used for several different transitions. One analysis of demo conversion benchmarks separates six of them, from visitor-to-request all the way to demo-to-customer. Only two of the six had public evidence strong enough to quote.
The same trap applies to the word “demo.” A demo can be the first qualifying call, a deep mid-funnel walkthrough or a late-stage validation session. SerpSculpt’s benchmark report points out that almost no two teams define it the same way, which explains most of the disagreement between published benchmarks.
A follow-up call is also not automatically a demo. ModernLeads warns that relabeling “follow-up call” as “demo” changes the outcome you are measuring. So here is the rule I use:
- Call-to-demo ratio covers calls to demos. Name the call type every time.
- Demo conversion rate is usually demo to opportunity or demo to closed deal. Name the end point every time.
If you remember one thing from this article, remember that a ratio without a named numerator and denominator is just a number.
How to calculate it, step by step
The math is one line. The discipline is in what you put into it.
Step 1: Pick one call type
Cold calls, warm calls and discovery calls behave differently. Monetizely’s guide advises tracking them separately, because blending them hides what is really happening. Where it goes wrong: a rep who works warm inbound leads looks like a star next to one who cold dials, and the dashboard cannot tell you why.
Step 2: Define the denominator
A useful denominator is unique opportunities or accounts with a completed, eligible discovery, not every dial or calendar invite, according to ModernLeads. If one account has three discovery calls, it counts once. If a call was a no-show, it does not belong in a discovery ratio at all.
Step 3: Define the numerator
Booked, held and qualified demos are different outcomes. Count completed demos, because they already clear scheduling and show-up. A calls-to-demo calculator uses the same logic: total demos completed divided by total calls made.
Step 4: Fix the time window
Use the same window for both sides. A discovery call on the 28th and a demo on the 3rd of the next month will split across two periods and distort both. Cohort by the week the discovery happened and check the demo outcome later.
Step 5: Write the definitions down
Put the definitions in your CRM fields and your sales ops doc. Consistent definitions, denominators and CRM tracking are what make call-to-demo reporting comparable from one quarter to the next.
A worked example: a rep completes 40 discovery calls in a month. Twelve of those accounts reach a completed demo. The discovery-to-demo ratio is 12 / 40 = 30%. If you had instead counted 40 calls against 18 scheduled demos, you would have reported 45% and overstated progress by half.

This is where we built TrailerCast to take work off your plate. Its AI notetaker joins Zoom, Meet and Teams calls and automatically distinguishes demos from qualifying calls, routing each into the right pipeline. That means your call types are tagged from the transcript, not from whatever a rep remembers to select afterward.
What is a good call-to-demo ratio in US B2B SaaS?
There is no universal answer, but there are defensible ranges. Here is how published figures line up when you read the definitions carefully.
| What is measured | Reported figure | Source |
|---|---|---|
| Cold call to meeting booked | 2-3% average, 6-10%+ for top performers | Cold calling benchmarks |
| Total dials to conversations | 9% | Measuring Up sales benchmarks |
| Conversations to qualified appointments | 23% | Measuring Up sales benchmarks |
| Discovery call to demo, median | 23% | Repwing 2026 benchmarks |
| Discovery to demo, mid-market (50-200 employees) | 35-45% healthy | Fairview glossary |
| Lead to demo, mid-market SaaS | 15-25% solid | SaaStr |
A few things stand out.
First, the spread is wide because the starting point differs. A median of 23% and a healthy band of 35-45% are both plausible for discovery to demo, since they describe different company sizes and different definitions.
Second, too high is a warning. Fairview reports that above 50% often means the qualification bar is too low, and below 25% signals an ICP mismatch. SaaStr’s Jason Lemkin makes the same point for lead-to-demo: below 15% suggests outreach or qualification problems, while above 25% could mean cherry-picking or a top of funnel that is too narrow.
Third, for volume context, the Bridge Group survey of 384 B2B SaaS companies, summarized by Blossom Street Ventures, reports account executives averaging 33 dials a day, 6.3 quality conversations a day and 6.8 demos a week.
My practical advice: pick the benchmark that matches your call type and your company size, then set your own target as a band, not a point. For most mid-market teams, 30-45% discovery-to-demo with a healthy demo-to-opportunity rate behind it is a sensible place to aim.
Why the ratio varies so much between teams
Three drivers explain most of the gap.
Lead source and data quality. Repwing’s 2026 report shows that 40-60 dials on researched, verified, segmented data convert at 2.8%, while 80+ dials on stale lists drop to 1.9%. More activity on worse data lowers the ratio.
Inbound versus outbound. Warm inbound leads arrive with intent. A cold-sourced discovery is a different animal, and MapsLeads reports no-show rates of 15 to 25 percent for cold-sourced discoveries against 5 to 10 percent for warm inbound.
Segment and deal complexity. Multi-stakeholder deals need more conversations before anyone agrees to see the product. A sales engineer running a technical walkthrough will count a demo very differently from an SDR booking a first meeting.
If your ratio is low and you have ruled out definitions, the cause is usually upstream: outreach targeting, ICP fit or lead quality. Teams working on that side often pair sales analytics with outreach and ICP fit troubleshooting to see which visitors and accounts are worth a call in the first place.

How to raise the ratio without hurting demo quality
The goal is more of the right demos, not more demos. Here is what the research supports.
- Run discovery like a gate, not a pitch. MapsLeads argues that discovery drifts toward “let me show you the product” when there are no explicit gates, and that a fit-check block is the highest-leverage fix. A structured question set helps; our discovery questions for SaaS sales and 30-minute discovery call framework lay one out.
- Put the demo on the calendar live. MapsLeads reports that calendar links sent afterward by email convert at half the rate of meetings booked live during the discovery call.
- Shorten the gap. Fairview reports that gaps longer than 7 days between discovery and demo cut attendance by 30-40%.
- Send an agenda the day before. Fairview recommends a confirmation email with agenda 24 hours ahead of the call, and tracking disposition on every call.
- Keep discovery and demo separate. Fairview also reports that close rates on combined discovery-and-demo calls run 15-20% lower than on properly sequenced ones.
- Review bottom-quartile calls against top performers. You will find the difference in the first five minutes more often than in the pitch.
Step 6 is where most managers run out of time. Reading transcripts for a whole team is slow. TrailerCast’s AI notetaker produces speaker-by-speaker transcripts, structured summaries, talk-time analysis, qualification verdicts and action items, and every transcript is searchable. That gives you the material for a bottom-quartile review without anyone rewatching hours of recordings. For the coaching side, see our conversation intelligence playbook.
Track it next to the numbers that follow it
Call-to-demo ratio alone can be gamed. Push reps on it and they will demo everyone. Pair it with the metrics on either side:
- Demo request rate. Monetizely cites a HubSpot 2023 report putting the average B2B SaaS demo request rate at around 2-5%, with top performers at 8-10%. Monetizely’s own guide adds that average demo completion rate hovers around 65-75%, and best-in-class teams reach 85% or more.
- Show rate. Measure it separately from discovery-to-demo so you know whether the problem is interest or logistics.
- Demo-to-opportunity and demo-to-close. SerpSculpt puts demos that become customers at roughly 15-25%, higher when the demo is a late-stage event and lower when counted from the first sales meeting.
Lemkin’s logic is a good diagnostic: if lead-to-demo is strong but demo-to-close is weak, the issue sits further down the funnel, not in the SDR’s qualification work. And if call-to-demo climbs while demo-to-opportunity falls, you are converting people who were never a fit.
The demo itself is also a lever. Champions rarely carry a two-hour recording to the CFO who missed the call. A short, personalized recap travels better, which is why we wrote about demo recap videos and product demonstration examples that move deals along.
What we think about call-to-demo ratio
I built TrailerCast because I kept seeing the same pattern: the calls were never the problem, the space between them was. A rep runs a good discovery, books a demo, and the deal still dies in a meeting you weren’t invited to.
That is why we don’t treat call-to-demo ratio as a rep scorecard. It is a signal about the whole deal. Call types need to be tagged consistently, discovery context needs to carry into the demo, and the demo needs to be something your champion can forward to a CFO or a CISO.
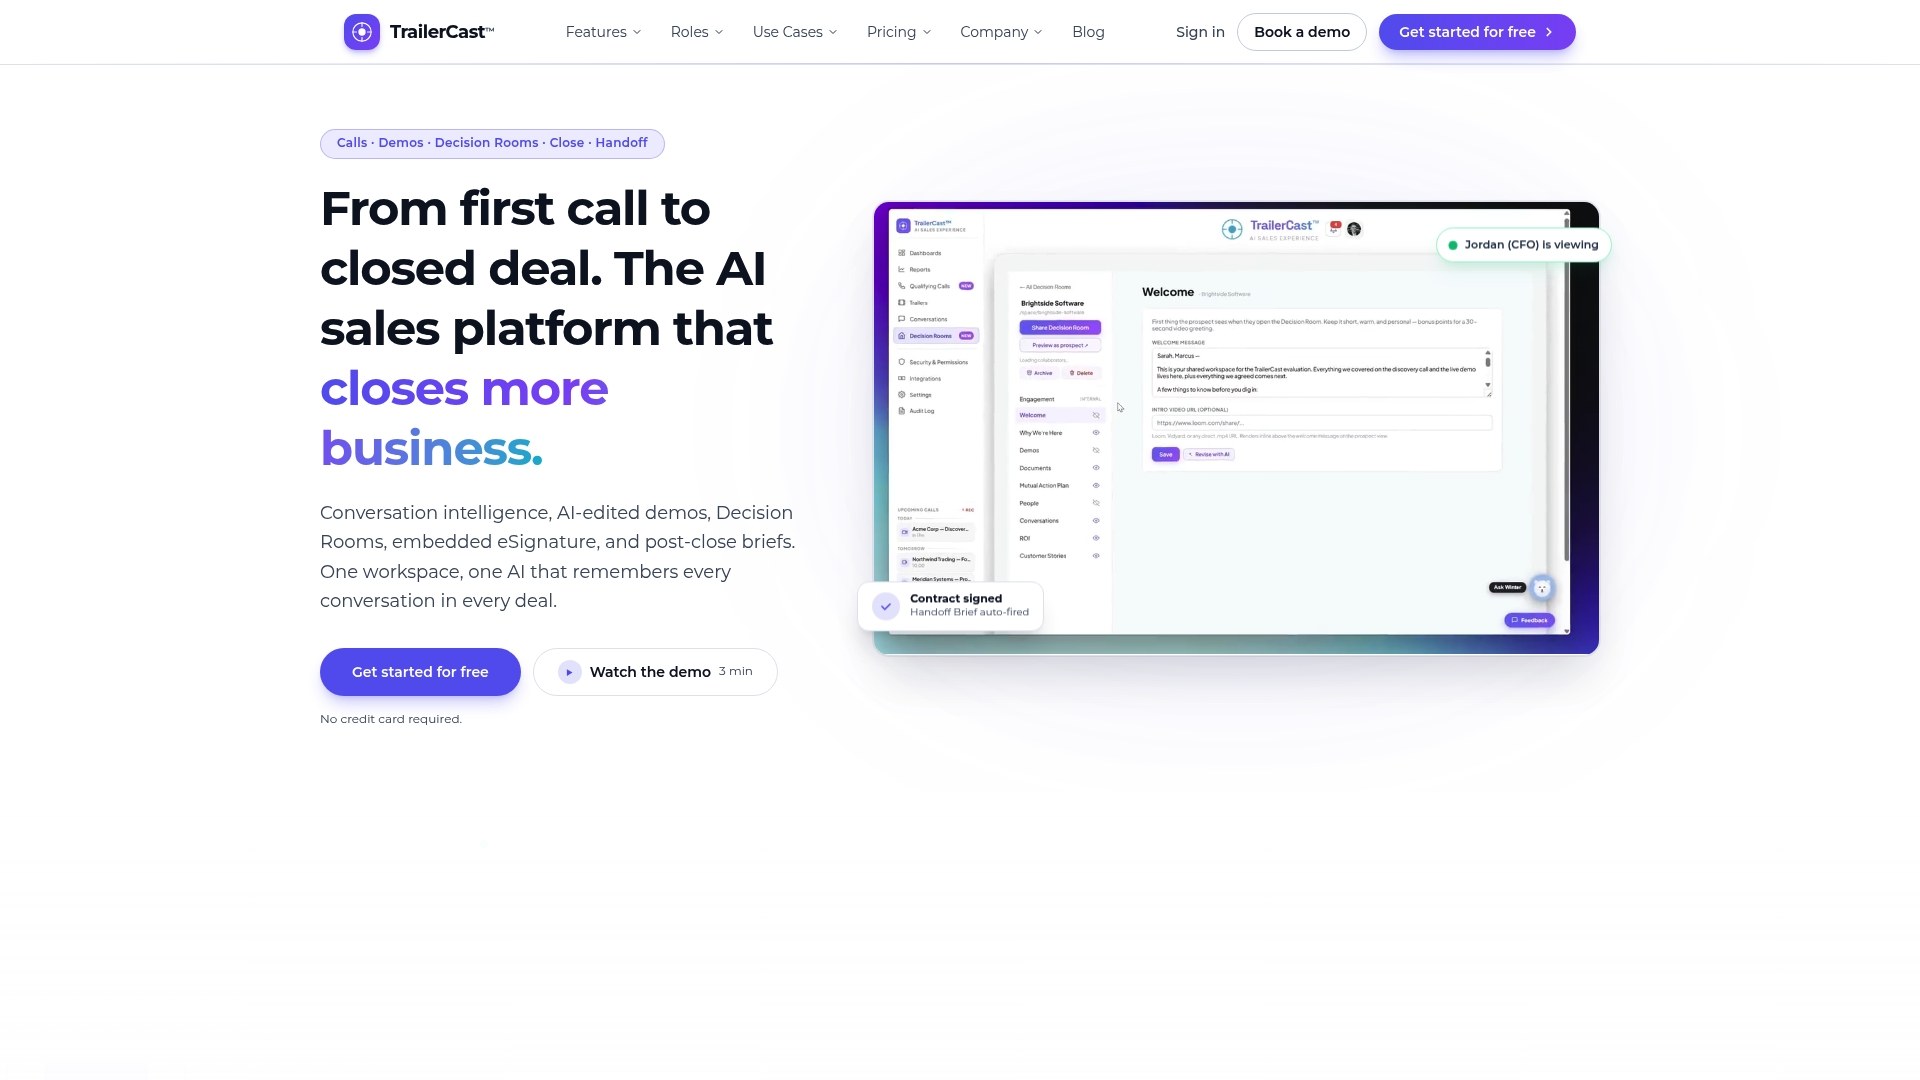
Our platform is designed to put calls, demos, buyer-facing decision rooms, eSignature and handoff in one workspace, with a single AI that follows the opportunity from the first call. When the same system records the call, tags it, summarizes it and builds the demo trailer, your ratio stops depending on who filled in which field. You get cleaner numbers and a deal that stays coherent between conversations.
Daniel
See your own ratio without the spreadsheet
If you want call types tagged automatically and every demo recap ready to forward, TrailerCast covers the lifecycle from first call to closed deal. Our AI notetaker joins your Zoom, Meet and Teams calls and sorts demos from qualifying calls, and the AI can turn a demo recording into a branded trailer built around the 8-15 minutes that mattered. There is one plan with every feature, from $59 per month per seat. See the plan or look at our AI notetaker for discovery calls.
FAQ
What is a good call-to-demo ratio?
For discovery calls in mid-market B2B SaaS, 35-45% is described as healthy by Fairview, while Repwing reports a 23% median. For cold calls, 2-3% to booked meetings is typical. Choose the benchmark that matches your call type and company size.
Is call-to-demo ratio the same as demo conversion rate?
No. Call-to-demo ratio measures how many calls become demos. Demo conversion rate usually measures what happens after the demo, such as demo to opportunity or demo to closed deal. Always state the start and end point when you quote either number.
Should I count scheduled demos or completed demos?
Count completed demos for the headline ratio, because they already clear scheduling and show-up. Track booked and held demos separately so you can see whether the drop-off is interest or attendance.
Can a call-to-demo ratio be too high?
Yes. Fairview reports that above 50% often means the qualification bar is too low. If demo-to-opportunity falls as your ratio rises, you are demoing prospects who are not a fit.
Sources
- Demo Conversion Rate Benchmarks: Only 2 of 6 Are Real
- B2B SaaS Demo-to-Close Rate Benchmarks (2026)
- Discovery-to-Demo Conversion Rate: 2026 Guide
- How to Track Call-to-Meeting Conversion Rates
- Calls to Demo Rate Calculator
- Measuring Up sales benchmarks report
- Discovery call-to-demo conversion rate benchmarks 2026
- Discovery Call: Definition, Fairview
- Discovery to Demo Conversion Playbook (2026)
- SaaStr: What’s a Good Lead-to-Demo Ratio
- SaaS account executive data and metrics
- Calculating Demo Request and Completion Rates