Content Engagement Tracking for Marketers and Sales Teams

Content engagement tracking is the practice of measuring the specific actions users take with your content — scrolls, video plays, CTA clicks, form submits — and mapping those events to business outcomes. That single signal tells you more about content quality than a month of pageview data.
The immediate benefits of getting this right:
- Better channel comparison: behavioral signals let you compare LinkedIn traffic vs. organic search by what visitors actually do, not just how many showed up.
- Clearer ROI: microconversions (video plays, CTA clicks, demo requests) connect content spend to pipeline in a way raw traffic never can.
- Faster content iteration: scroll depth and video completion data pinpoint exactly where readers and viewers drop off, so edits are surgical rather than guesswork.
Three authoritative anchors ground this practice: GA4’s engaged session definition (10+ seconds, a conversion, or 2+ pageviews), YouTube’s audience retention reports with percentile-point drop-off analysis, and the StormID event taxonomy framework that separates interaction events from activation events.
Key Takeaways
Effective content engagement tracking requires a clean event taxonomy, the right tool stack, and a direct line from signals to decisions — whether that’s an editorial edit or a sales rep alert.
| Point | Details |
|---|---|
| Start with three micro-events | Fire engaged_reader, video_progress, and cta_click first — these cover editorial, video, and conversion signals. |
| Separate event types | Distinguish user actions, system attempts, and external outcomes to keep attribution clean and backfills reliable. |
| Use account-level aggregation for B2B | Single-user signals mislead deal health scoring; aggregate across all stakeholders in a buying committee. |
| Automate alerts at thresholds | Trigger rep notifications when demo watch percentage exceeds 75% — real-time routing beats manual report review. |
| Trailercast for demo engagement | Trailercast tracks per-stakeholder demo views, replays, and buyer portal activity in one workspace, replacing five separate tools. |
Table of Contents
- What content engagement tracking actually covers — and who needs it
- Key engagement metrics, formulas, and when to use each
- How to instrument engagement tracking: event taxonomy and naming conventions
- Concrete implementation: the
engaged_readerevent - Which tools collect, analyze, and visualize engagement signals
- How to turn engagement signals into content improvements and sales workflows
- Real-world example: tracking engagement on sales demos and decision rooms
- Sampling and data quality issues in engagement tracking
- Cross-channel attribution for engagement metrics
- Real-time vs. batch data processing approaches
- Automating reports and alerts based on engagement data
- Data privacy and compliance considerations
- Trailercast makes demo engagement visible across every stakeholder
- A practitioner’s honest take on where most teams go wrong
- Sources
What content engagement tracking actually covers — and who needs it
The scope is wider than most teams realize. Content engagement tracking spans web articles and landing pages, gated assets (PDFs, whitepapers), email links, video content on YouTube or embedded players, sales demo recordings, and buyer-facing decision rooms. Each channel produces different signals, but they all feed the same question: did this content move someone closer to a decision?
Engagement signals fall into three categories:
- Behavioral: scroll depth, time on page, video play rate, replay events, click-through on CTAs. These are the raw inputs — what the user physically did.
- Sentiment: comments, shares, reactions, and qualitative survey responses. Harder to collect at scale, but they explain why behavioral signals look the way they do.
- Outcome: form submits, newsletter signups, trial starts, purchases, eSignature clicks. These are the conversions that justify the content investment.
Marketing teams and sales teams use these signals differently, and that distinction matters for how you instrument. A content manager at a media company cares about scroll depth and newsletter conversion rate — they want to know which articles earn loyal readers. A sales rep cares about whether a CFO watched the pricing section of a demo trailer or whether a CISO opened the security one-pager in a buyer portal. Same underlying data model, completely different decision context.
GA4’s engaged session concept (a session lasting 10+ seconds, triggering a conversion, or viewing at least two pages) is the standard web anchor for behavioral engagement. For video, YouTube’s audience retention reports show exactly where viewers exit using percentile points at 1%, 25%, 50%, 75%, and 100% of a video’s length. Both are worth treating as your baselines before you build anything custom.
Key engagement metrics, formulas, and when to use each
Most teams track too many metrics and act on too few. The ones below are the ones that actually drive decisions.
Engagement rate = Engaged sessions ÷ Total sessions. GA4 reports this natively. A sudden drop usually signals a traffic-quality problem (a new paid campaign bringing unqualified visitors) rather than a content problem.
Time on page = Timestamp of last interaction minus timestamp of first pageview. Meaningful only when paired with scroll depth — a high time-on-page with low scroll depth often means a tab left open, not a reader absorbed in your content.
The Contentsquare engagement tracking guide recommends tracking this as a distribution, not an average, because the average masks a bimodal pattern (many people who leave immediately plus a core group who read everything).
Video play rate = Video plays ÷ Video impressions. Low play rate points to a thumbnail or placement problem, not a content problem.
YouTube’s retention graphs break this down at percentile points so you can see the exact moment a segment loses viewers.
Microconversions: video play, CTA click, share, form start. These are the leading indicators that predict macro conversions.
Macro conversions: signup, trial start, purchase, eSignature. The outcomes that justify everything above.
DAU/WAU/MAU and retention: for content products (newsletters, learning platforms, content hubs), daily and weekly active user ratios tell you whether you’re building a habit or just attracting one-time visitors.
| Metric | Events required | When to use |
|---|---|---|
| Engagement rate | session_start, engaged_session |
Campaign quality comparison, editorial benchmarking |
| Scroll depth | scroll (percent_scrolled property) |
Diagnosing article drop-off, CTA placement |
| Video completion | video_complete, video_progress |
Demo effectiveness, course completion |
| Microconversion rate | cta_click, video_play, form_start |
Funnel optimization, content-to-pipeline |
| Newsletter signup rate | form_submit (type: newsletter) |
Editorial ROI, subscriber growth |
| Demo watch percentage | demo_watch_percentage |
Sales qualification, deal health scoring |
How to instrument engagement tracking: event taxonomy and naming conventions
A clean event model saves you months of cleanup later. The core principle, drawn from StormID’s event taxonomy guidance, is to separate three types of events: user actions (what the person did), system attempts (what your code tried to do), and external outcomes (what a downstream system confirmed). Mixing these three in a single event stream makes attribution unreliable and backfills painful.
A practical taxonomy for content and sales teams:
| Event name | Type | Key properties | Implementation note |
|---|---|---|---|
pageview |
System | page_url, content_id, campaign |
Fire on every page load; deduplicate by session |
scroll |
User action | percent_scrolled, content_id, session_id |
Use GTM scroll trigger at 25/50/75/100% |
engaged_reader |
Micro-event | content_id, user_id, scroll_pct, time_on_page |
Fire when scroll ≥50% AND time ≥30s |
video_play |
User action | video_id, content_id, play_position |
Player SDK callback |
video_progress |
User action | video_id, percent_watched, timestamp |
Fire at 25/50/75/100% thresholds |
cta_click |
User action | cta_id, content_id, destination_url |
GTM click trigger on CTA elements |
form_start |
User action | form_id, content_id |
GTM form interaction trigger |
form_submit |
External outcome | form_id, content_id, conversion_type |
Server-side confirmation preferred |
demo_watch_percentage |
User action | demo_id, account_id, stakeholder_id, percent |
Demo platform SDK or webhook |
buyer_portal_activity |
User action | room_id, account_id, stakeholder_id, action_type |
Decision room platform event |
Naming conventions: use snake_case, keep names under 40 characters, and prefix category-specific events (demo_, buyer_, email_) to make filtering easy in any analytics store. Never use spaces or camelCase — they create inconsistencies across tools.
Deduplication: assign a unique event_id (UUID) to every event at the point of generation. On the receiving end, use that ID as an idempotency key so retries don’t double-count. For client-side events, a session-scoped flag prevents the same threshold event from firing twice in one session.
Data retention: GA4’s default event-level data retention is 2 months (extendable to 14 months in settings). For raw event export, BigQuery export is the standard route. api.video’s analytics API defaults to 30-day retention for video event data, with options to extend — plan your export schedule before you need the historical data.
Pro Tip: Keep event payloads minimal. Send only the properties you will actually query. A payload with 30 properties per event inflates storage costs and makes schema changes painful. Use a consistent UTM schema (utm_source, utm_medium, utm_campaign, utm_content) on every distributed content link so you can trace engagement back to its distribution source without joining five tables.
Concrete implementation: the engaged_reader event
The engaged_reader signal is a proxy for “this person actually read the article.” A pageview tells you someone loaded the page. An engaged_reader event tells you they stayed long enough and scrolled far enough to have consumed the content. Sealmetrics documents this pattern as a standard micro-event for content publishers, with formulas for engaged reader rate, read completion rate, and newsletter conversion rate built on top of it.
Here’s a minimal JavaScript implementation you can adapt:
(function() {
  var scrollReached = false;
  var timeReached = false;
  var fired = false;

  window.addEventListener('scroll', function() {
    var scrollPct = (window.scrollY + window.innerHeight) / document.body.scrollHeight * 100;
    if (scrollPct >= 50) scrollReached = true;
    checkAndFire();
  });

  // Time threshold: 30 seconds
  setTimeout(function() {
    timeReached = true;
    checkAndFire();
  }, 30000);

  function checkAndFire() {
    if (scrollReached && timeReached && !fired) {
      fired = true;
      // Push to dataLayer for GTM
      window.dataLayer = window.dataLayer || [];
      window.dataLayer.push({
        event: 'engaged_reader',
        content_id: document.querySelector('meta[name="content-id"]')?.content || window.location.pathname,
        scroll_pct: 50,
        time_on_page: 30
      });
    }
  }
})();
Adjust scrollPct >= 50 and the 30000 millisecond timeout to match your content type.
Integrating with GTM or an analytics SDK:
- Add the snippet above as a Custom HTML tag in GTM, triggered on “All Pages” (or a specific page type).
- Create a Custom Event trigger in GTM listening for
engaged_reader. - Map
content_id,scroll_pct, andtime_on_pageas Data Layer Variables. - Fire a GA4 Event tag with those variables as event parameters.
For server-side validation, receive the event via a server-side GTM container or your own endpoint, verify the content_id exists in your CMS, and write to your analytics store with a server-generated timestamp.
After deploying, verify:
- Open GTM Preview mode and load a test article.
- Scroll past 50% and wait 30 seconds — confirm
engaged_readerappears in the event stream. - Check that
content_idis populated correctly (notundefined). - Verify the event appears in GA4 DebugView within 30 seconds.
- Confirm the event does not fire twice in a single session (the
firedflag handles this, but test it).
Which tools collect, analyze, and visualize engagement signals
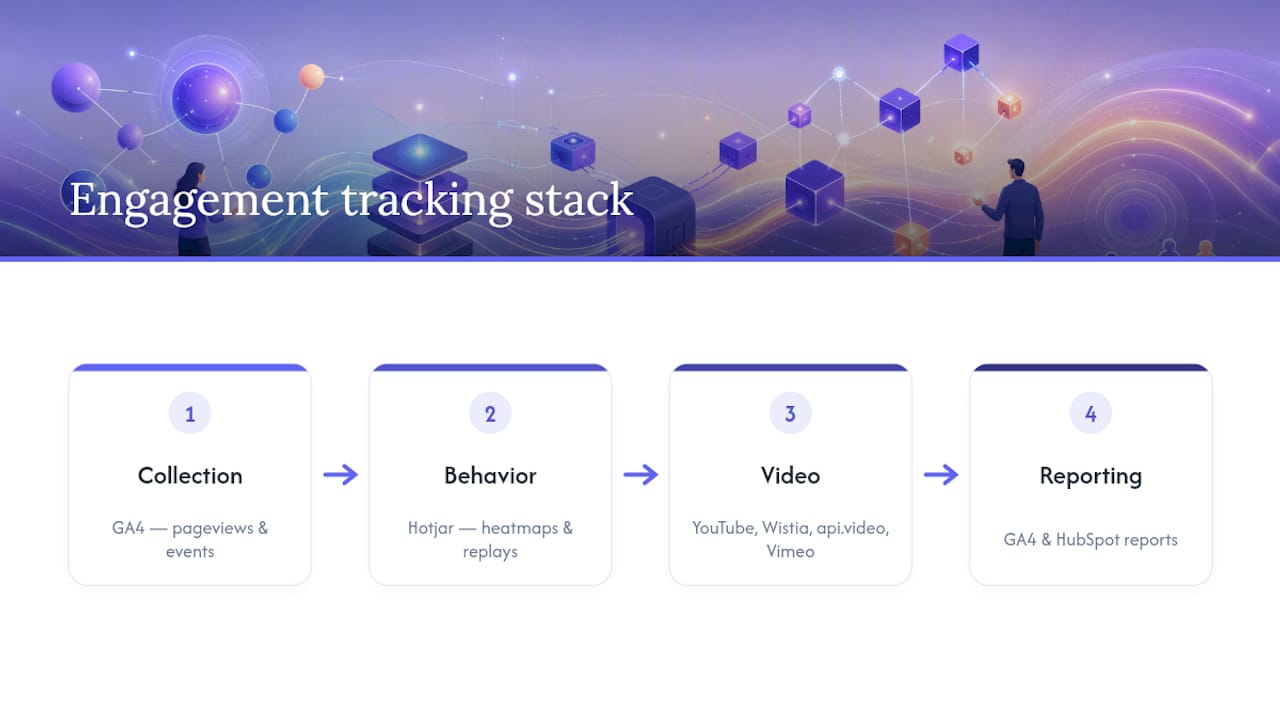
No single tool does everything well. The practical approach is a layered stack: one collection layer, one behavior analysis layer, one video analytics layer, and one reporting layer.
Google Analytics 4 (GA4) is the default collection and reporting layer for web engagement. It captures pageviews, scroll events, video progress (for YouTube embeds), and custom events via the dataLayer. The engaged session metric is native. BigQuery export gives you raw event-level access for custom modeling. GA4 is the right starting point for almost every team because it’s free, widely documented, and integrates with Google Tag Manager without custom code.
Hotjar sits in the behavior analysis layer. It’s particularly useful for editorial teams diagnosing low scroll depth on articles that GA4 flags as underperforming. Hotjar captures scroll heatmaps, click maps, and session replays, and its free tier covers basic use cases for smaller sites.
HubSpot operates as both a CRM and a content analytics layer for marketing teams. It tracks email opens, link clicks, landing page conversions, and CTA performance natively. For sales teams, HubSpot’s contact activity timeline connects content interactions (a prospect clicked a pricing page link in an email) to deal records. Its strength is attribution within the marketing funnel, not raw event capture — it works best when paired with GA4 rather than replacing it.
YouTube Analytics is the authoritative source for video engagement on YouTube-hosted content. Its engagement reports surface watch time, average view duration, and audience retention curves with percentile-point breakdowns. The retention graph shows you the exact second viewers exit, which is the most direct signal for editing decisions. For sales teams using YouTube to host demo content, the channel-level data is useful; for prospect-level tracking, you need a different player.
Ahrefs plays a different role: content discovery and organic performance research, not event capture. Use it to identify which content topics drive qualified organic traffic, benchmark your content’s search visibility, and find pages where high rankings aren’t converting to engagement. Ahrefs tells you what to create and which existing pages deserve optimization investment — then GA4 and Hotjar tell you how those pages actually perform once visitors arrive.
For video analytics beyond YouTube: Wistia’s analytics provides second-by-second heatmaps, play rate, and viewer-level engagement data that can be forwarded to CRMs to trigger sales workflows. api.video offers an analytics API with aggregated metrics, dimensional breakdowns, and timeseries endpoints — useful when you’re building a custom video experience and need programmatic access to engagement data. Vimeo’s engagement tables include view-at-percentile columns (1/25/50/75/100) and export options for deeper analysis.
On mixing tools: the cleanest architecture sends all client-side events through a single dataLayer, then routes them to multiple consumers (GA4, your CRM, your data warehouse) via server-side GTM or a CDP. Siloed integrations — where each tool has its own tracking snippet — create event duplication, inconsistent naming, and attribution conflicts that take weeks to untangle.
For teams exploring AI behavioral analytics to score engagement signals at the account level, the same principle applies: one clean event stream feeding the scoring model beats five partial streams that each miss something.
How to turn engagement signals into content improvements and sales workflows
Signals are only useful when they change what you do next. Here’s a practical action loop:
- Diagnose: pull scroll depth distribution and video completion rates for your top 20 content pieces. Flag anything where fewer than 40% of sessions reach the 50% scroll mark, or where video completion drops below 30%.
- Hypothesize: for low-scroll articles, the problem is usually in the first 300 words — the hook doesn’t earn the scroll. For low-completion videos, check the first 90 seconds.
- Experiment: edit the intro, test a new thumbnail, or restructure the opening section. For videos, a shorter, sharper opening often lifts completion more than any other change.
- Measure: re-run the same metrics after 2–3 weeks of traffic. Compare engaged reader rate before and after, not just pageviews.
- Roll out: apply the winning pattern to similar content in the same category.
For sales teams, the workflow is more specific.
Wistia’s CRM integrations automate exactly this pattern for video-hosted content. For tracked async video follow-ups in a B2B deal context, the same logic applies at the stakeholder level — not just “did someone watch” but “which stakeholder watched, how much, and did they share it with anyone else.”
Real-world example: tracking engagement on sales demos and decision rooms
B2B demo tracking is where generic web analytics breaks down. A single deal might involve a CFO, a CISO, a VP of Engineering, and a procurement lead — each watching different content, at different times, from different devices. Aggregating their signals at the account level, not the user level, is what tells you whether the deal is progressing. Gartner’s B2B buying journey research supports this: buying committees behave as a unit, and single-user signals routinely mislead deal health scoring.
The events worth capturing for demo and decision-room tracking:
demo_start: the prospect pressed play on a demo recording.demo_watch_percentage: fired at 25/50/75/100% thresholds, withstakeholder_idandaccount_idas properties.highlight_replay: a viewer rewound and rewatched a specific segment — the highest-intent signal in a demo.participant_join: a new stakeholder entered the buyer portal or decision room.demo_trailer_view: a stakeholder viewed an AI-edited trailer (shorter, personalized version of the full demo).buyer_portal_activity: any action inside the decision room (document view, comment, mutual action plan update).eSignature_click: the prospect opened or signed the contract.handoff_brief_generated: the post-close brief fired to Customer Success.
| Event | Why it matters for sales | Recommended alert/automation |
|---|---|---|
demo_watch_percentage ≥75% |
Strong buying intent; prospect engaged with the full pitch | Alert rep immediately; suggest follow-up within 2 hours |
highlight_replay |
Prospect revisited a specific feature or pricing segment | Flag the replayed segment; prep a targeted follow-up on that topic |
participant_join (new stakeholder) |
Deal is expanding to new decision-makers | Update stakeholder map; send personalized content for new role |
buyer_portal_activity |
Deal is active between calls | Log activity to CRM; update deal health score |
eSignature_click |
Close is imminent | Trigger CS handoff workflow |
Trailercast instruments all of these natively. Its AI demo trailers are auto-edited from full recordings and can be personalized per stakeholder — a CFO version that leads with pricing, a CISO version that leads with security. The engagement panel in each buyer portal shows per-stakeholder activity, and champion forwarding is tracked as an attribution tree so you can see who shared the trailer with whom. The moment a trailer goes live, the surface flips from “share it to start tracking” to live engagement analytics as soon as the first prospect presses play.

Sampling and data quality issues in engagement tracking
GA4 applies sampling to some reports when event volumes are high, which means the numbers you see in the standard interface may not reflect your full dataset. The threshold varies by property type and report complexity, but sampling typically kicks in on reports that query large date ranges or apply multiple dimensions simultaneously. The fix is BigQuery export: raw, unsampled event data that you can query directly. For any decision that matters — content investment, campaign budget allocation — always verify against unsampled data before acting.
Beyond sampling, the most common data quality problems are:
- Bot traffic: automated crawlers inflate pageviews and session counts. GA4’s bot filtering handles most known bots, but internal traffic (your own team testing pages) needs to be excluded via IP filter or a developer traffic filter in GA4 settings.
- Inconsistent event naming: if one developer fires
video_playand another firesvideoPlay, you have two event streams that look like separate behaviors. A documented naming convention, enforced at the schema level, prevents this. - Missing
content_id: events without a content identifier can’t be attributed to specific pieces. Makecontent_ida required property in your event schema and add a validation step in your server-side container that drops events missing it. - Clock skew: client-side timestamps can be unreliable (users with wrong system clocks, delayed event fires). Use server-received timestamps as the authoritative time for sequencing events, and treat client timestamps as approximate.
Data quality governance doesn’t need to be complex. A simple schema registry (a shared doc or a tool like dbt’s schema tests) that validates event names and required properties catches most problems before they reach your reporting layer.
Cross-channel attribution for engagement metrics
The challenge with cross-channel attribution is that the same prospect might read a blog post via organic search, watch a demo trailer shared by email, open a buyer portal via a direct link, and sign via a link in a Slack message. Each touchpoint contributes to the outcome, but standard last-click attribution gives all the credit to the Slack link.
A practical approach for content and sales teams:
UTM discipline is the foundation. Every distributed content link — email, social, paid, partner — needs a consistent UTM schema. Without it, you can’t distinguish organic from email traffic in GA4, and you can’t trace which distribution channel drove the engaged readers who eventually converted.
Multi-touch attribution models (linear, time-decay, position-based) are available in GA4’s attribution settings and in HubSpot. For content-heavy funnels, a time-decay model often reflects reality better than last-click: the blog post that introduced the brand matters, but the demo trailer watched the day before signing matters more.
For B2B deals with long cycles, account-level attribution is more useful than user-level. Track which content pieces appeared in the deal’s engagement history across all stakeholders, not just the primary contact. This is where a sales content library with tracked sharing becomes valuable — you can see that the security one-pager was shared three times within an account before the CISO signed off.
Email share tracking is a specific gap in most setups. When a champion forwards a demo trailer or a one-pager to a colleague, that forward is invisible to standard analytics unless the link carries a unique tracking parameter. Platforms that generate per-recipient links or track forwarding as a distinct event (rather than just a new session from a shared URL) give you the attribution data that standard tools miss.
Real-time vs. batch data processing approaches
The choice between real-time and batch processing depends on what you need to do with the data.
Real-time processing makes sense for sales alerts and personalization triggers. The same applies to in-session personalization — showing a different CTA based on scroll depth requires a decision in milliseconds, not hours.
Batch processing is the right choice for reporting, trend analysis, and model training. Nightly or hourly BigQuery jobs that aggregate engagement metrics across your content library are cheaper to run and easier to maintain than streaming equivalents. Most editorial decisions (which articles to update, which topics to prioritize) don’t need data that’s fresher than 24 hours.
A hybrid architecture covers both needs: stream events to a real-time consumer (your CRM or sales platform) for alerts and triggers, and simultaneously write the same events to a data warehouse (BigQuery, Snowflake, Redshift) for batch reporting. The event model is identical — you’re just routing the same stream to two destinations.
One practical note: api.video’s timeseries endpoints distinguish between interval-based counting (how many plays occurred in a given time window) and summed metrics (total plays to date). Understanding that distinction matters when you’re building dashboards — a timeseries chart of plays per day and a total-plays metric answer different questions and shouldn’t be conflated.
Automating reports and alerts based on engagement data
Manual reporting is the bottleneck that kills most engagement programs. You set up the tracking, the data flows in, and then someone has to pull it every week. Automate that step and the data actually gets used.
GA4 scheduled reports let you email a standard report to stakeholders on a fixed schedule. For more flexibility, Looker Studio (formerly Google Data Studio) connects to GA4 and BigQuery and supports automated email delivery of dashboards on a daily or weekly cadence.
Threshold-based alerts are the highest-value automation for sales teams. Set up a webhook or a CRM workflow rule that fires when a contact’s engagement score crosses a threshold — for example, when the sum of demo_watch_percentage events for an account exceeds 200 points (roughly two stakeholders watching a full demo). The alert goes to the rep with the account name, the content watched, and a suggested action.
It focuses editorial attention on the pieces that need work rather than celebrating the ones that are already performing.
Slack and email integrations via Zapier, Make, or native CRM workflows handle most alert routing without custom code. The pattern is: analytics event fires → webhook hits your CRM or automation tool → rule evaluates threshold → notification sent to the right person with the right context.
For RevOps teams managing pipeline reporting, automated QBR briefs that pull engagement data across all active deals give leadership a consistent view of content’s contribution to pipeline without manual data assembly.
Data privacy and compliance considerations
Engagement tracking involves collecting behavioral data about real people, and U.S. privacy law is no longer a single federal standard. California’s CCPA/CPRA, Virginia’s VCDPA, Colorado’s CPA, and a growing list of state laws each impose different requirements on data collection, consent, and deletion. If you’re tracking users across your content properties, you need to know which states your visitors come from and which laws apply.
The practical requirements for most content and sales teams:
- Consent management: if you use cookies or persistent identifiers for tracking, a consent management platform (CMP) like OneTrust or Cookiebot lets visitors opt out. For sales demo tracking in a B2B context, you’re typically tracking known contacts who have engaged with your sales process — different rules apply than for anonymous web visitors.
- Data minimization: collect only the event properties you will actually use. A
scrollevent doesn’t need a user’s email address. Keeping payloads minimal (as the Pro Tip above recommends) is also a privacy best practice. - Retention limits: define and enforce data retention periods. GA4’s 14-month maximum for event-level data is a reasonable default for most teams. Raw event data in BigQuery should have a documented retention policy and automated deletion.
- User-level vs. aggregate tracking: for anonymous web visitors, aggregate metrics (scroll depth distribution, video completion rate) carry far lower privacy risk than user-level event streams. Where possible, use aggregate signals for editorial decisions and reserve user-level tracking for known contacts in your CRM.
For teams handling user-level engagement data, Trailercast’s security and data handling policies cover how engagement data is stored and processed within the platform.
This article provides general information about privacy considerations in engagement tracking, not legal advice. Confirm your specific compliance obligations with qualified legal counsel.
Trailercast makes demo engagement visible across every stakeholder
Most sales teams are flying blind between calls. A champion watches a demo, says it went well, and then the deal stalls in a committee meeting the rep never attended. The problem isn’t the demo — it’s that nobody knows what happened after it.
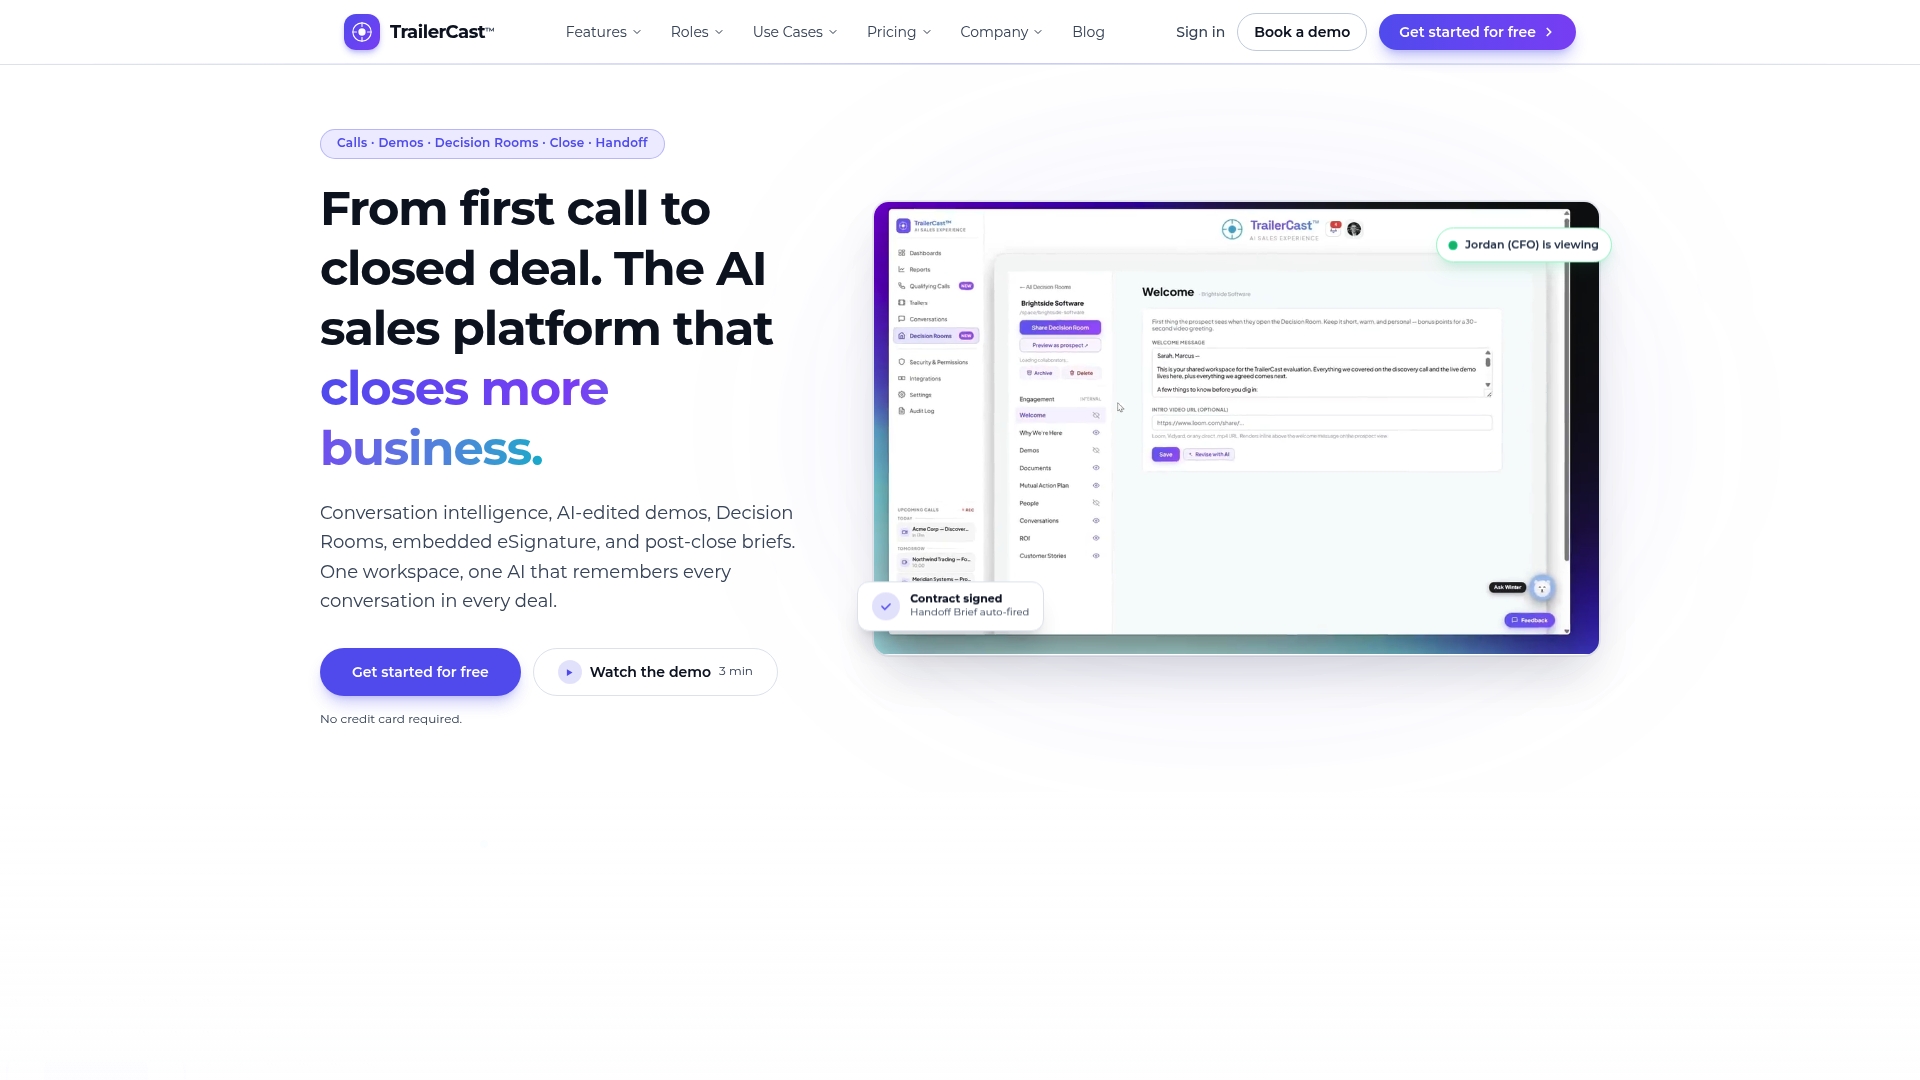
Trailercast instruments the entire space between conversations. Its AI demo trailers are auto-edited from full recordings and personalized per stakeholder, so your champion has something worth forwarding rather than a 90-minute recording nobody will rewatch. Every view, replay, and share is tracked at the stakeholder level inside a branded decision room, giving reps a live engagement panel that shows exactly who watched what and for how long. When a new stakeholder joins the room, the rep knows. When the CFO replays the pricing segment, the rep knows that too.
The platform covers the full deal cycle: conversation intelligence on calls, AI-edited trailers from demos, tracked async video follow-ups, embedded eSignature, and an AI-generated handoff brief that fires to Customer Success the moment a contract signs. One workspace, five tools replaced, $59/seat/month billed annually. Trailercast — no credit card required.
A practitioner’s honest take on where most teams go wrong
The biggest mistake I see is instrumenting everything on day one. Teams spin up GA4, add Hotjar, configure HubSpot, and then spend three months arguing about which number is right because the three tools don’t agree. Start with two events that connect directly to a business decision you’re already making. For editorial teams, that’s engaged_reader and newsletter_signup. For sales teams, it’s demo_watch_percentage and buyer_portal_activity. Get those two right — consistent naming, clean properties, verified in DebugView — before you add anything else.
The second mistake is inconsistent naming. One sprint you fire video_play, the next sprint someone fires videoPlay, and six months later you have two parallel event streams that look like separate behaviors in every report. A naming convention document that lives in your team’s wiki, reviewed at every sprint planning, prevents this. It sounds boring. It saves weeks.
The third mistake is tracking engagement without connecting it to a decision. Scroll depth data is interesting. Scroll depth data that tells your content team which articles to rewrite next week is useful. Before you instrument anything, write down the decision it will inform. If you can’t name the decision, don’t build the tracking.
Sources
These are the technical docs worth bookmarking before you write a single line of tracking code:
- Sealmetrics — Content & Media use cases
- About engagement reports — YouTube Help
- api.video analytics overview
- Understanding Content Engagement: Key events to track and metrics to choose — StormID
- Website engagement tracking guide — Contentsquare